The objective of the present experiment is to test a variety of hypotheses related to real-time adaptive modeling on a chaotic datasource. Among our tests, we include a comparison of the popular XGBoost and CatBoost machine learning libraries. Further, we explore the differences between the GPU and CPU algorithms in the respective libraries. Finally, we explore the effect of dimensionality reduction through PCA.
Five FreqAI instances are configured to train separate regressor models for 19 cryptocurrency pairs (/USDT):
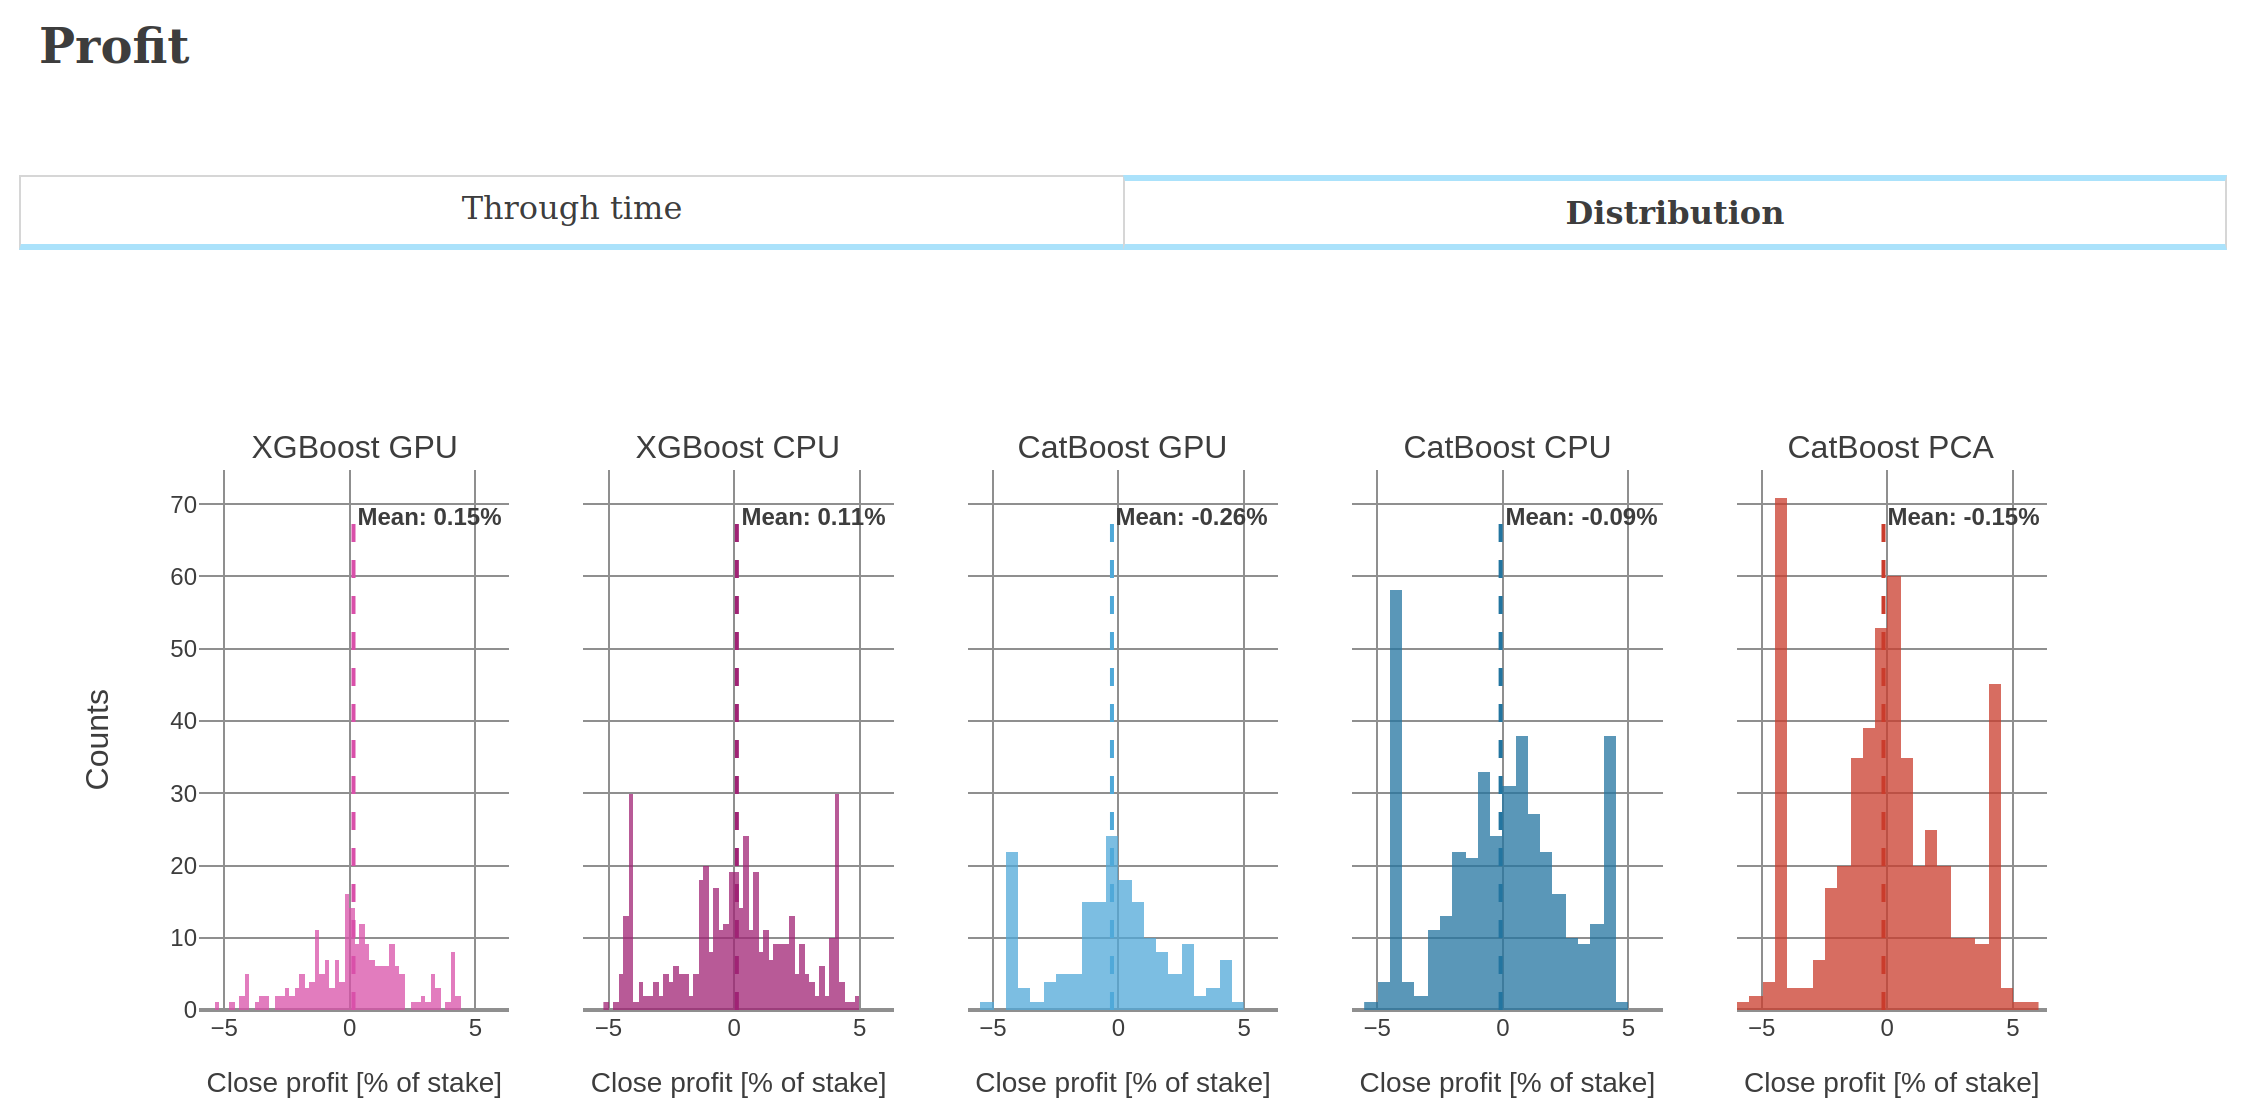
CatBoost CPU and GPU: solely exchange-derived features;
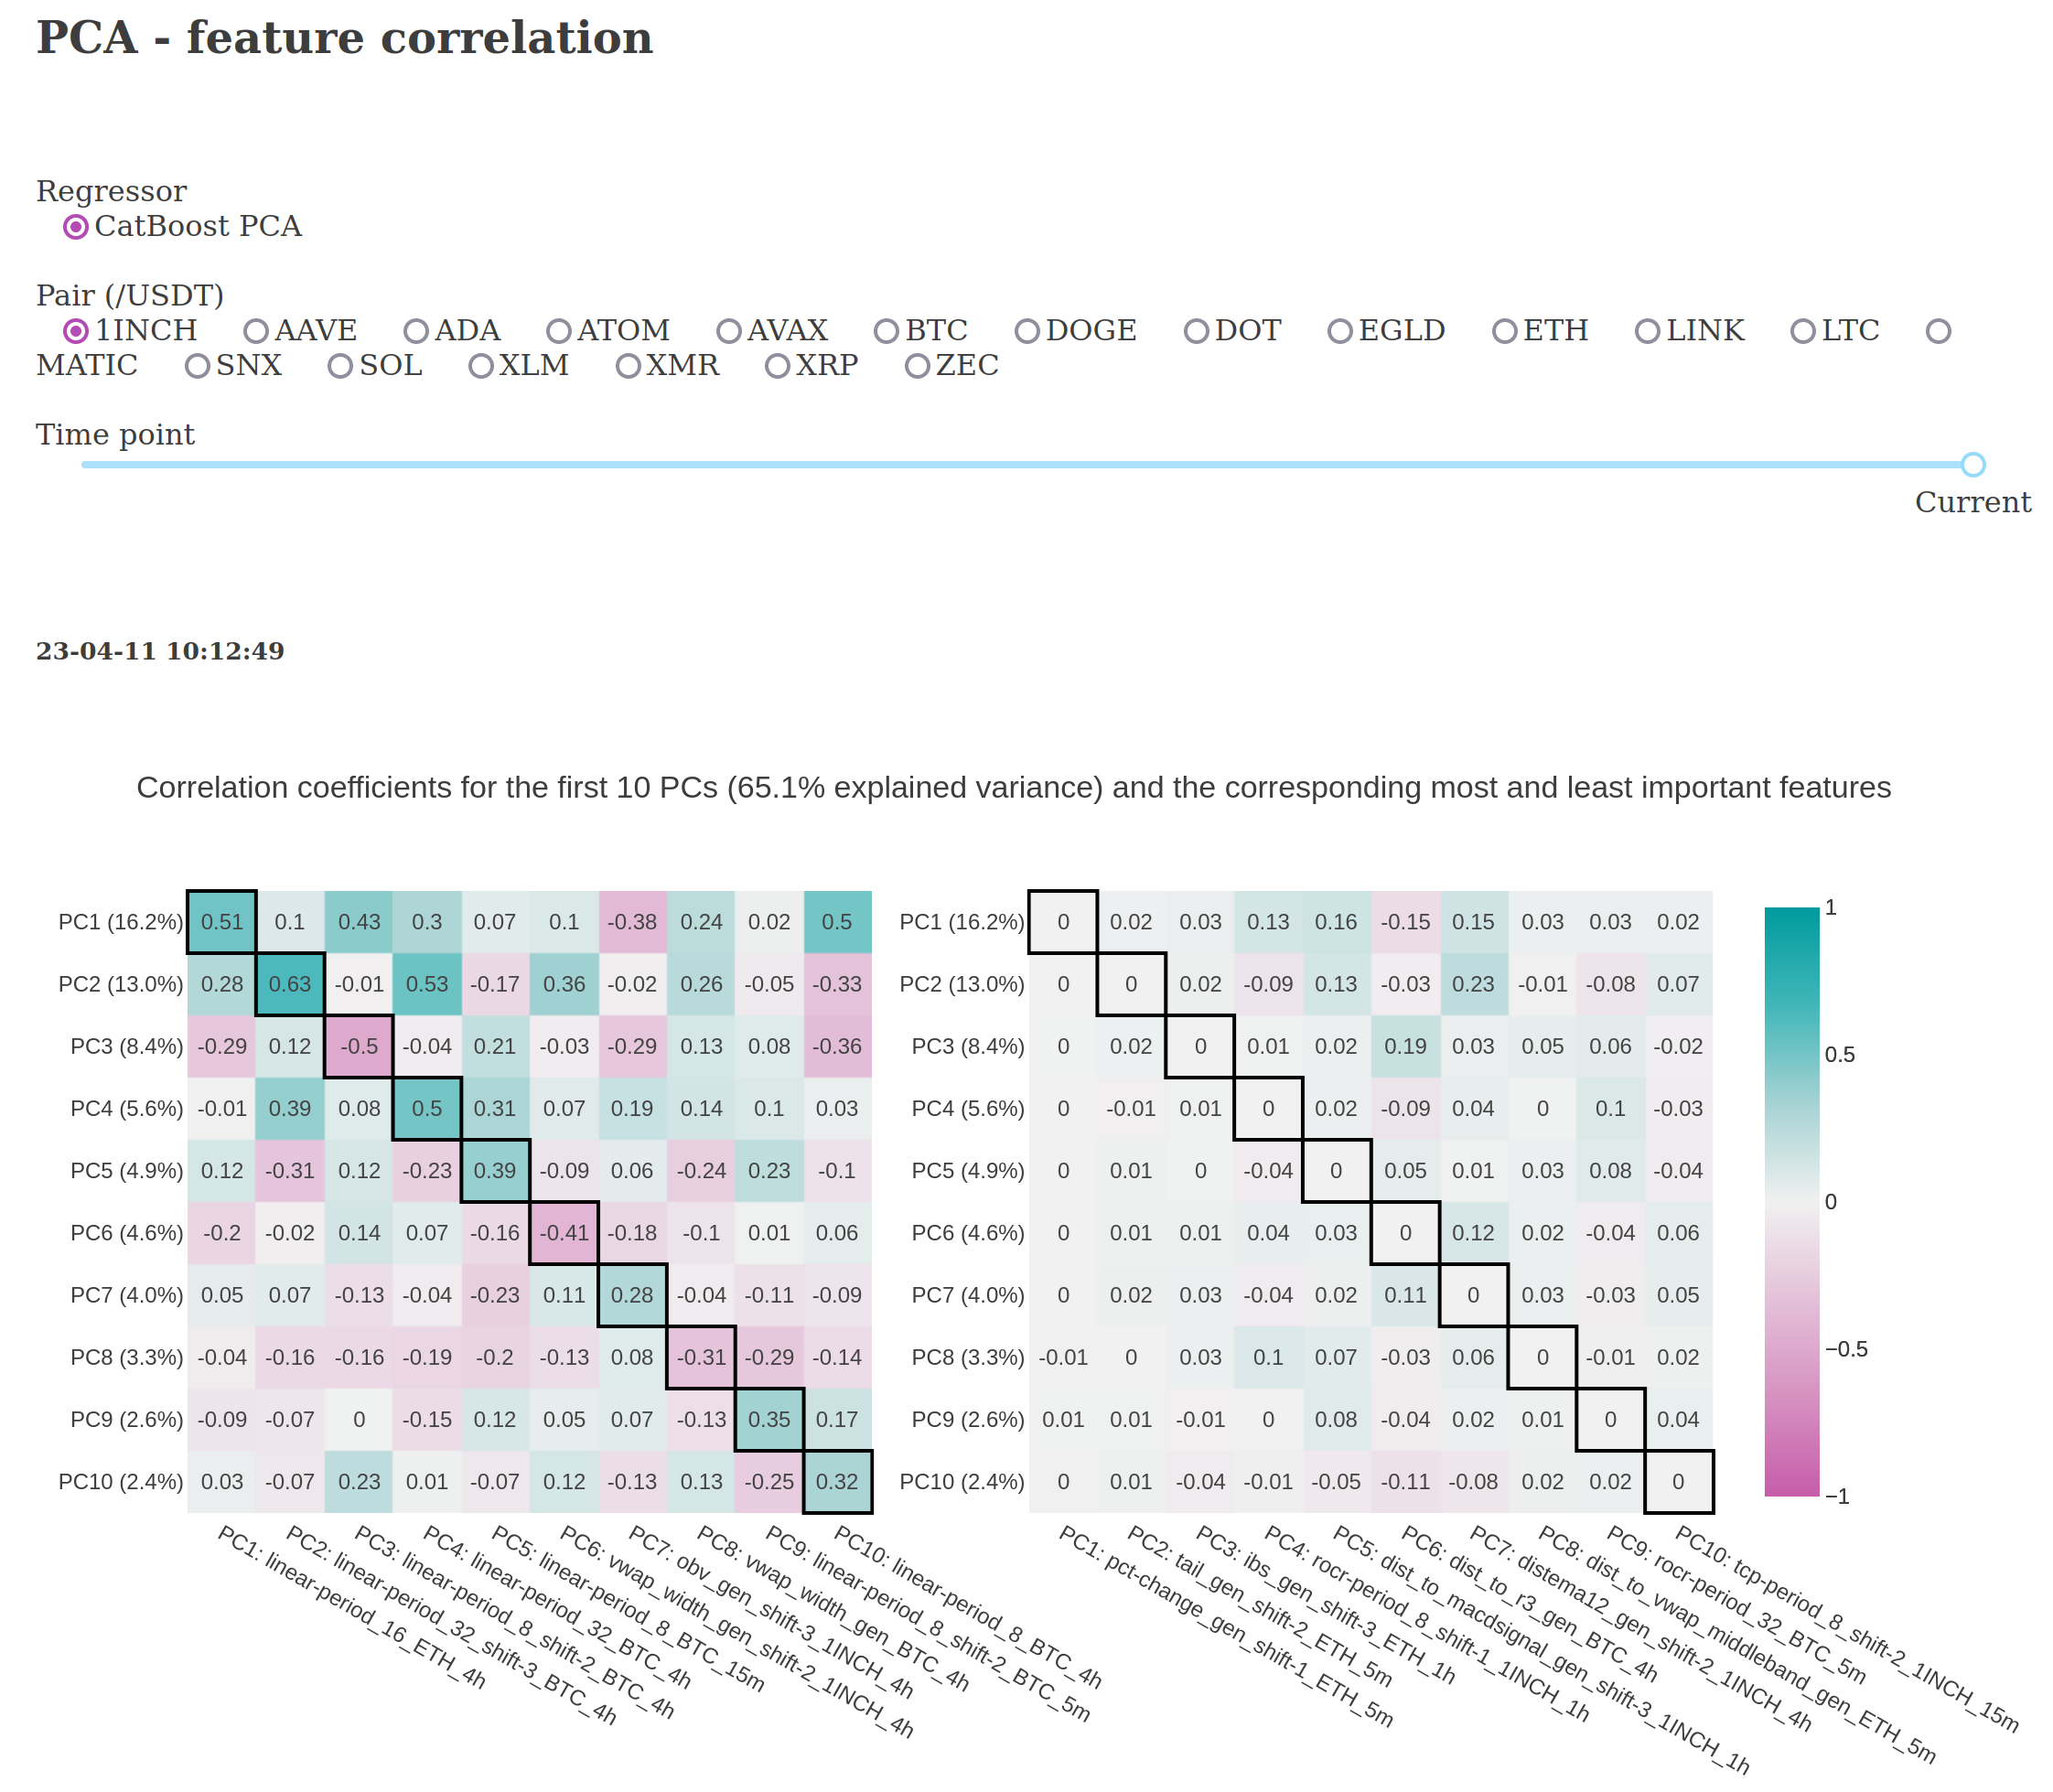
CatBoost CPU PCA: exchange-derived features after PCA transform for dimensionality reduction;
XGBoost CPU and GPU: solely exchange-derived features.
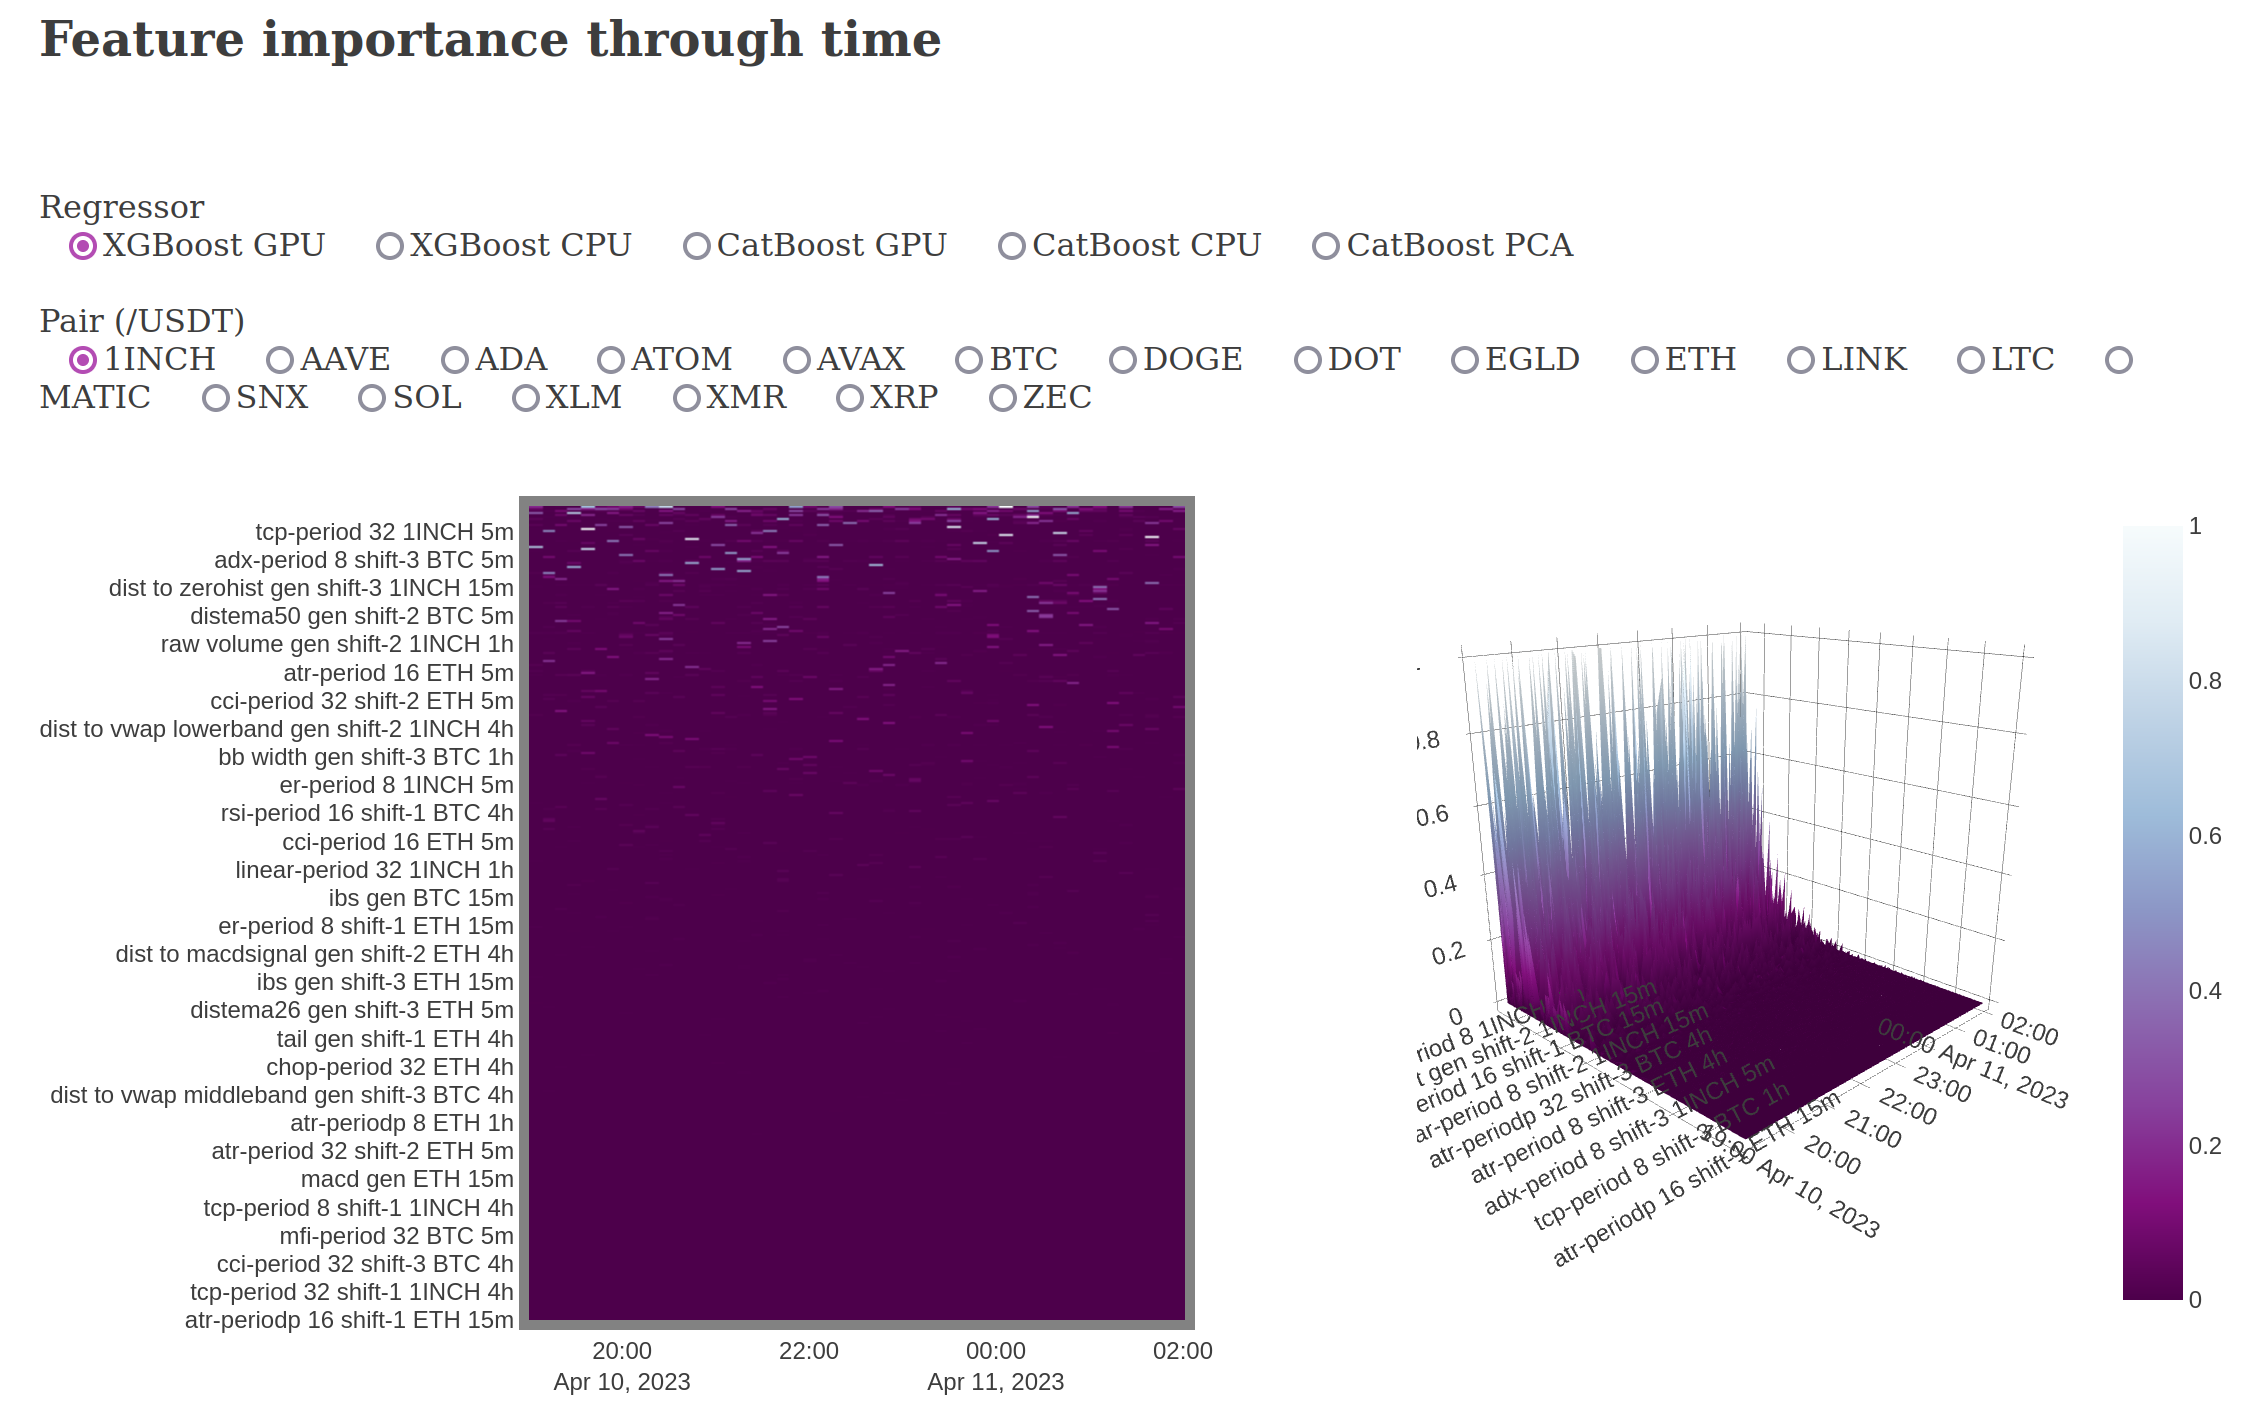
The cluster is actively generating 95 models (5 per coin x 19 coins) with 3.3k features per model models, and training new models every 5 min - 2 hours (depending on hardware and algorithm).
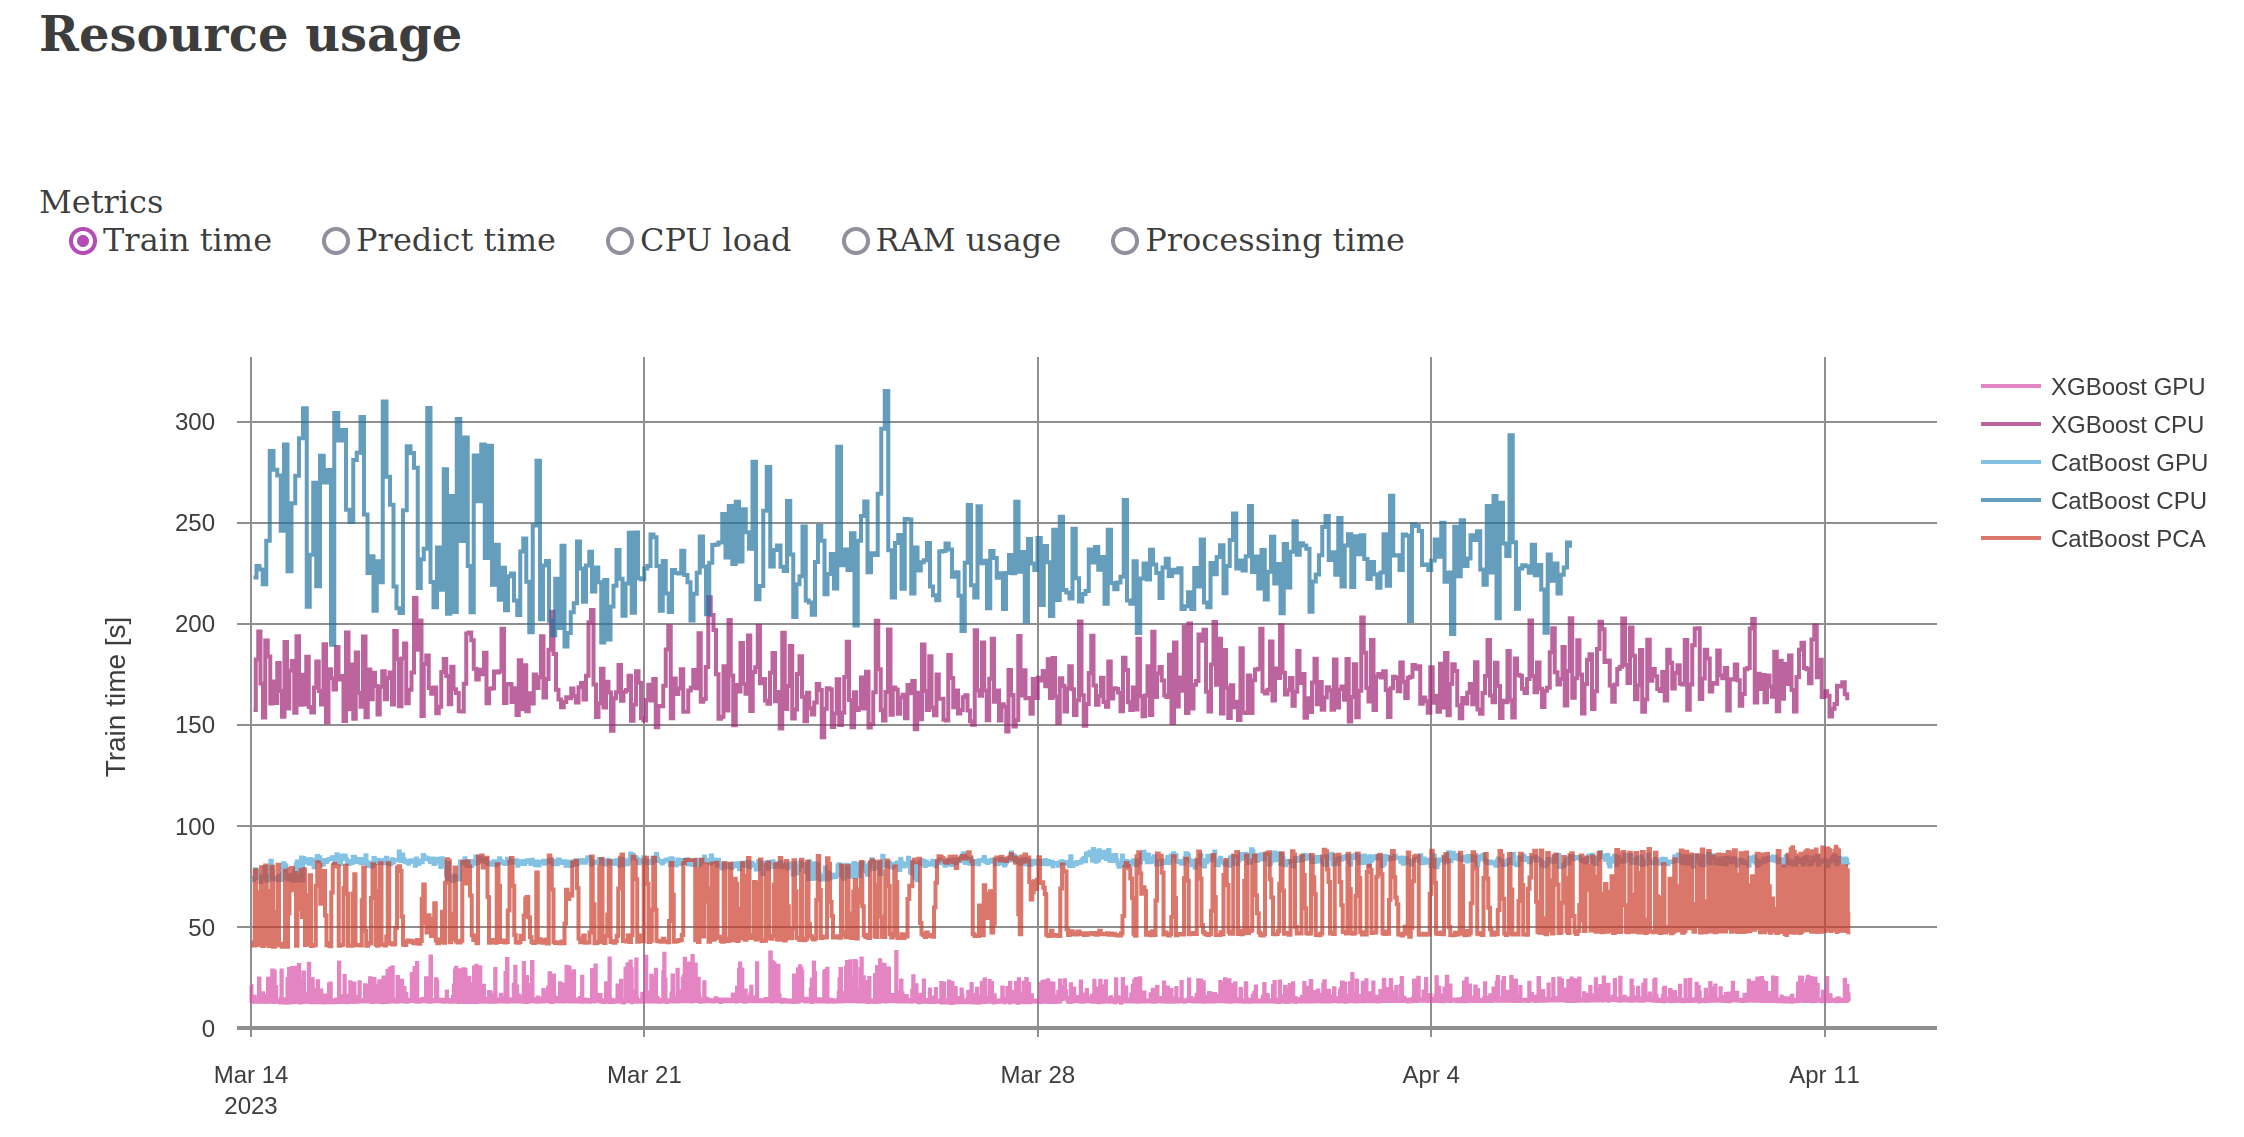
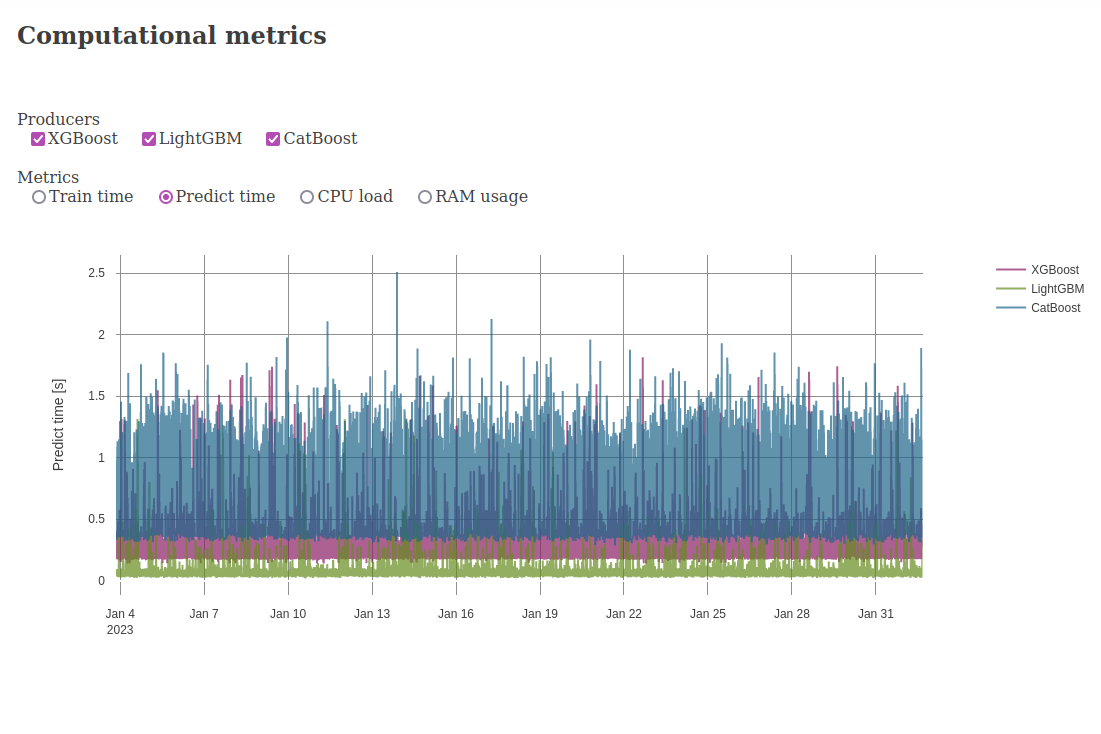
The CatBoost and XGBoost GPU variants are each running on modern 16 core 3.9 GHz processors with 256 GB RAM, and A4500 GPUs. Meanwhile, the CatBoost and XGBoost CPU variants are running on recycled 12 core 2.8 GHz servers with 64 GB RAM (circa 2012). All performance metrics of the hardware are shown below.
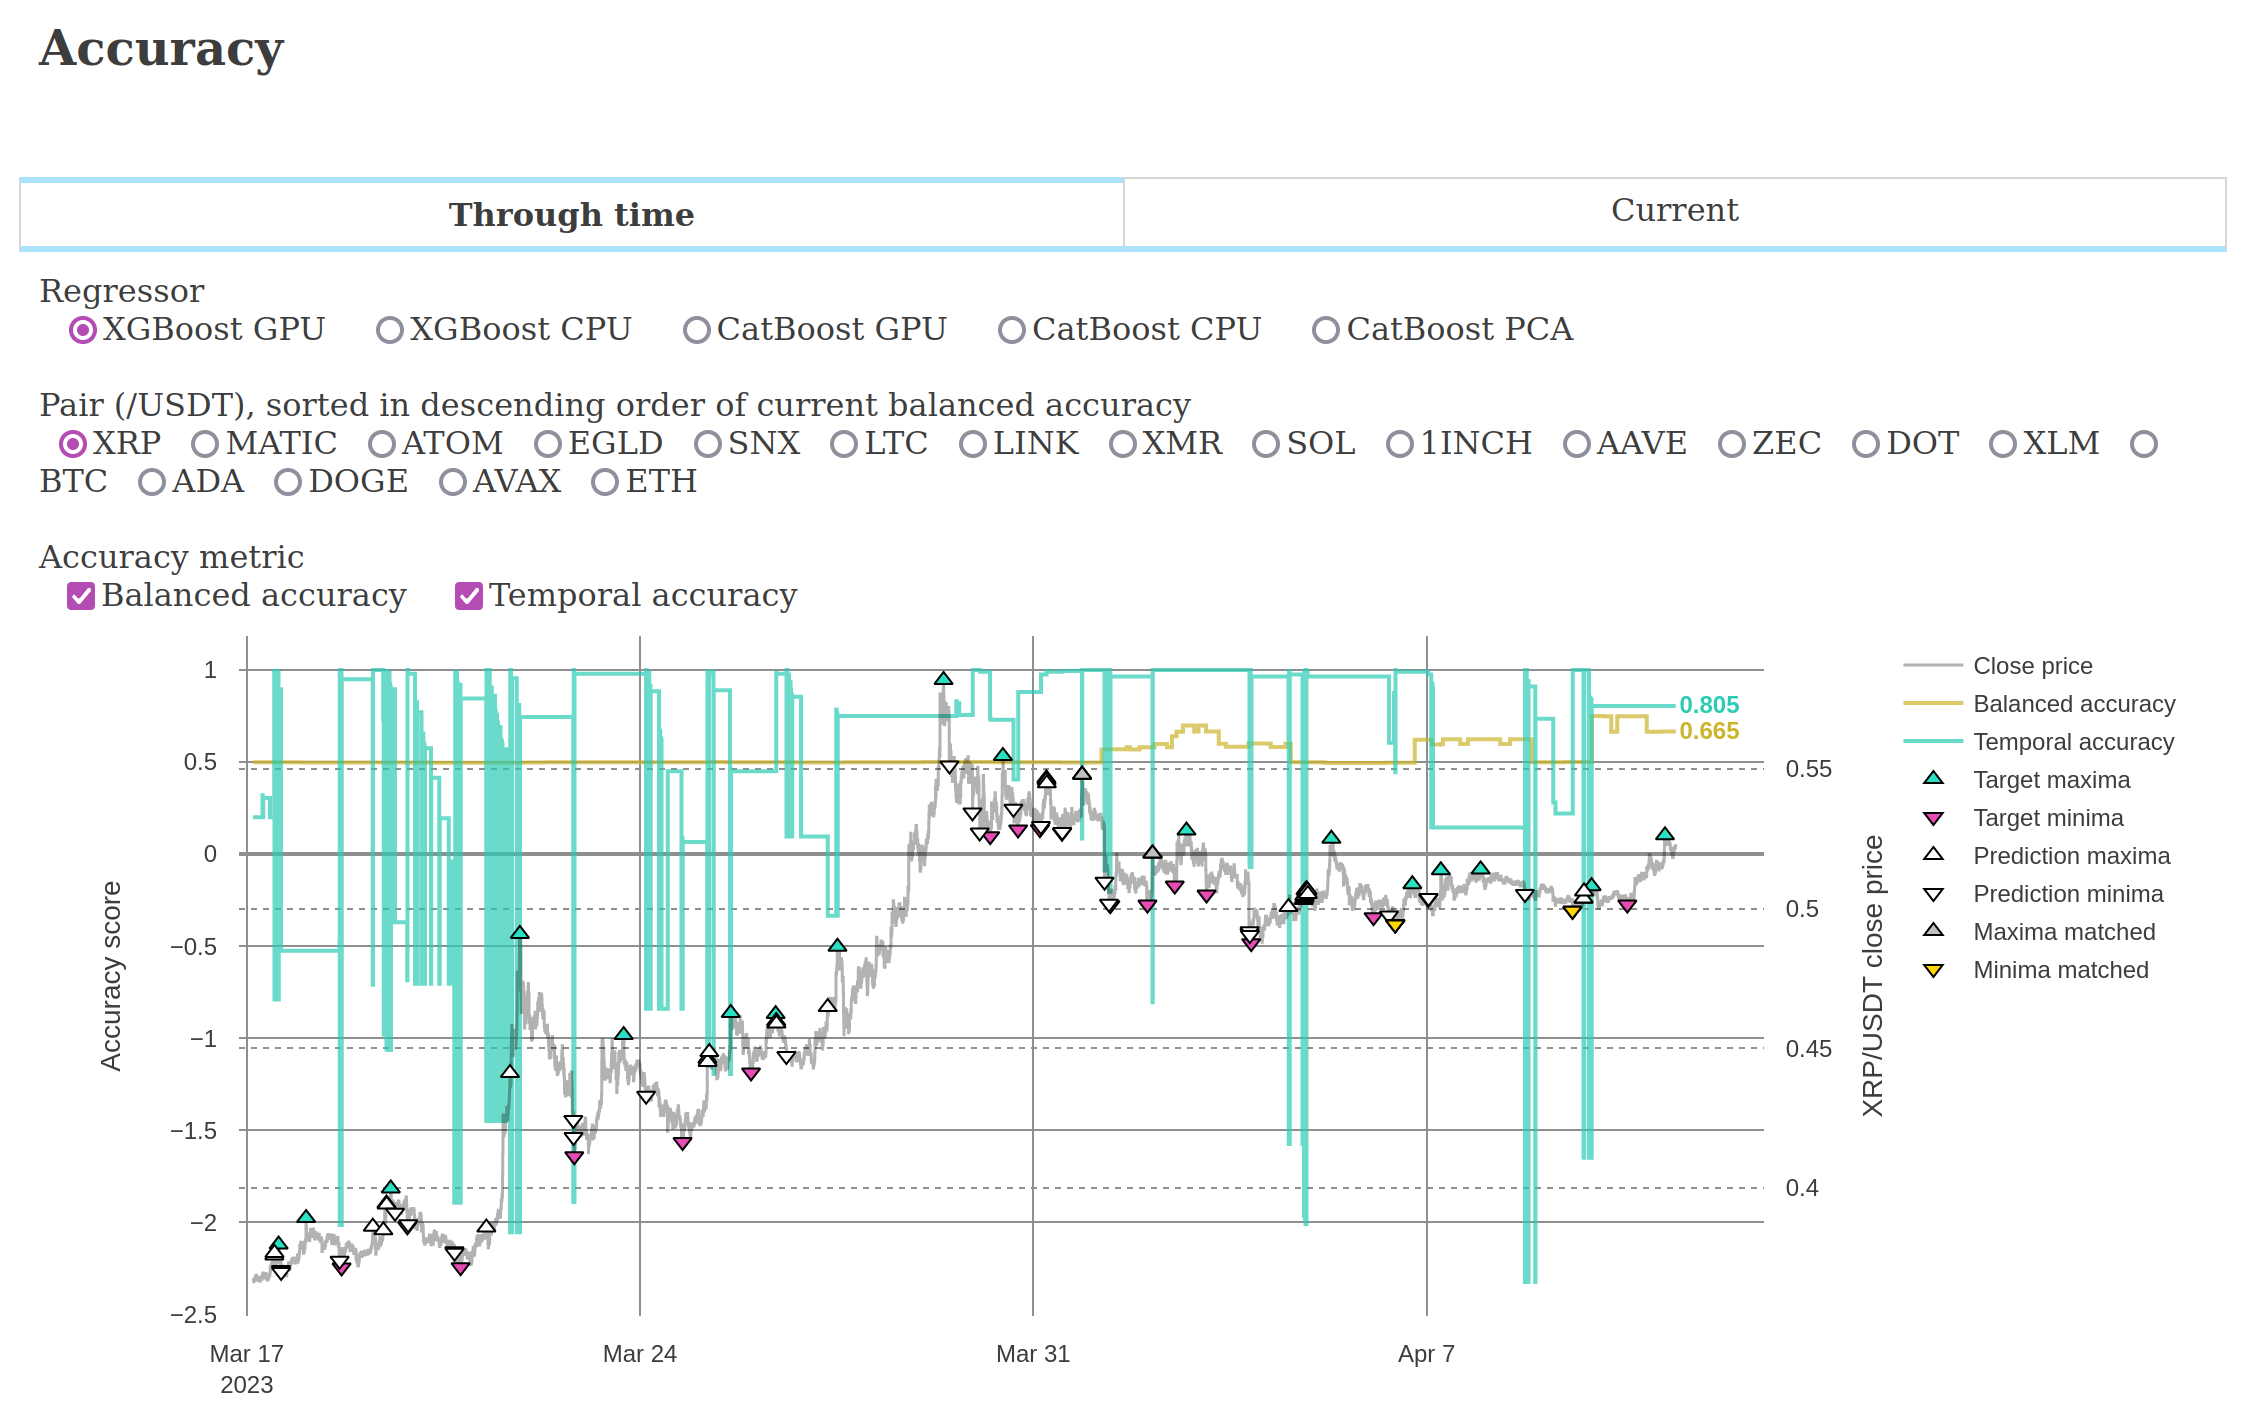
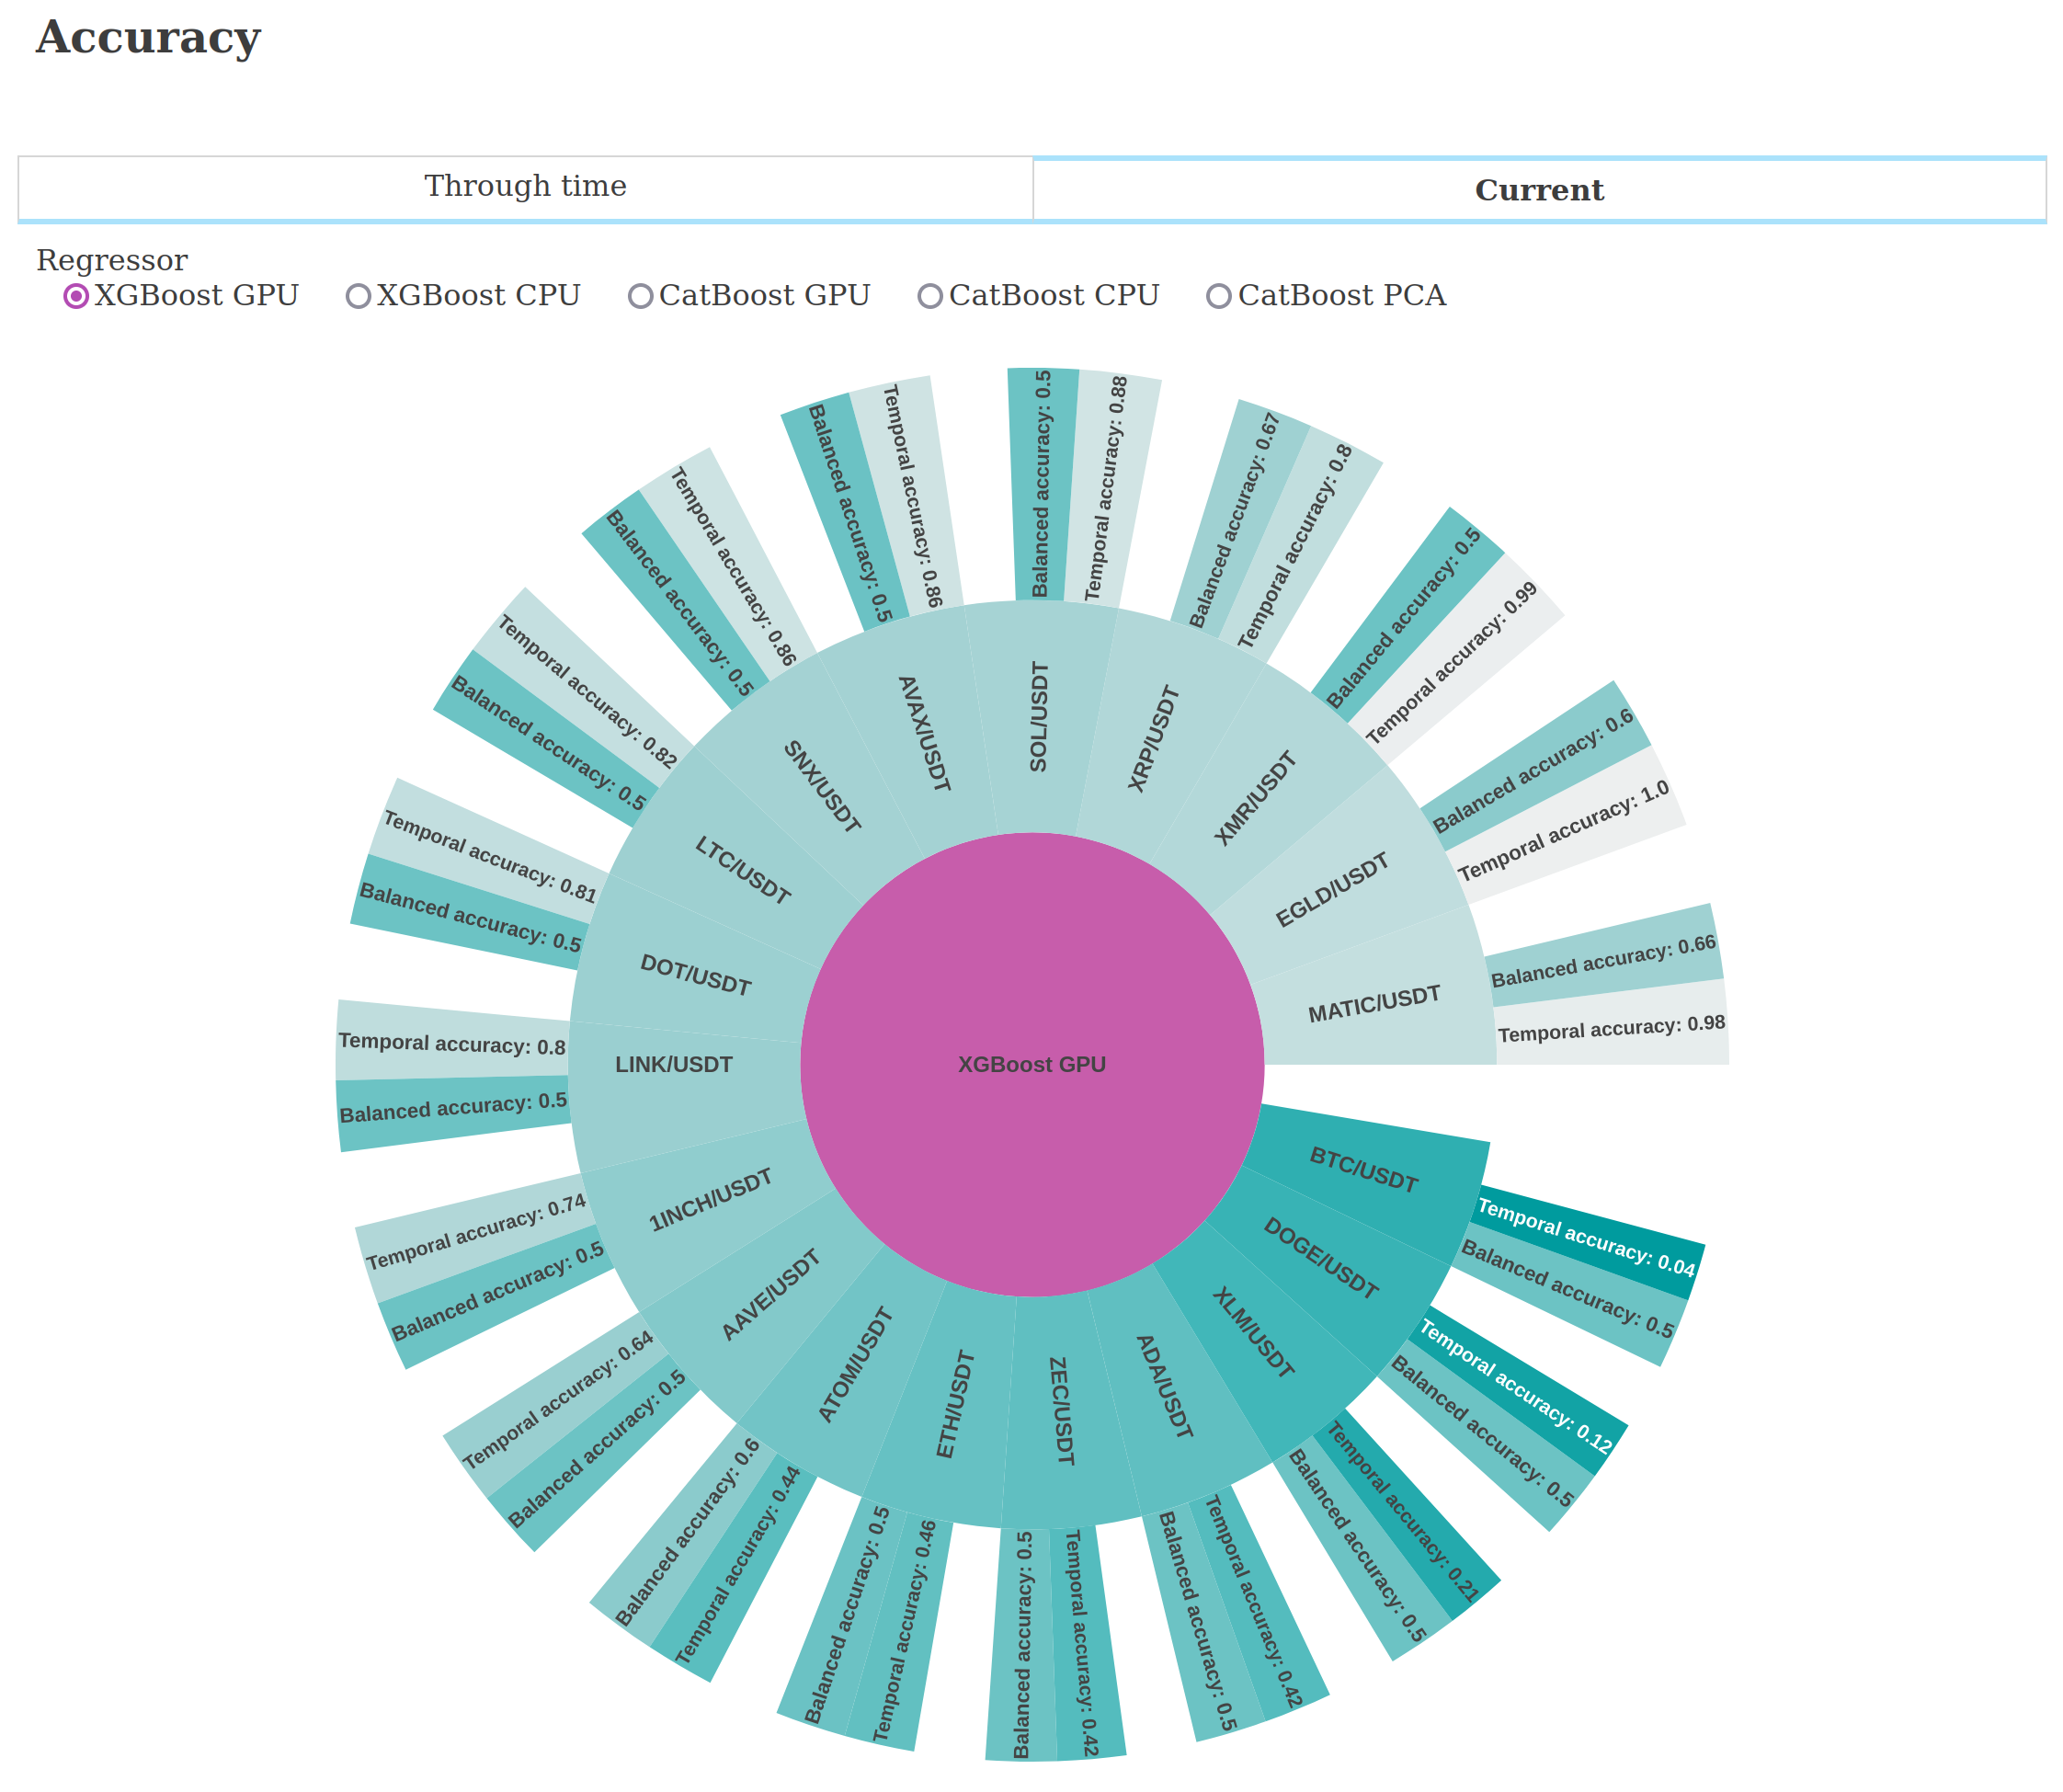
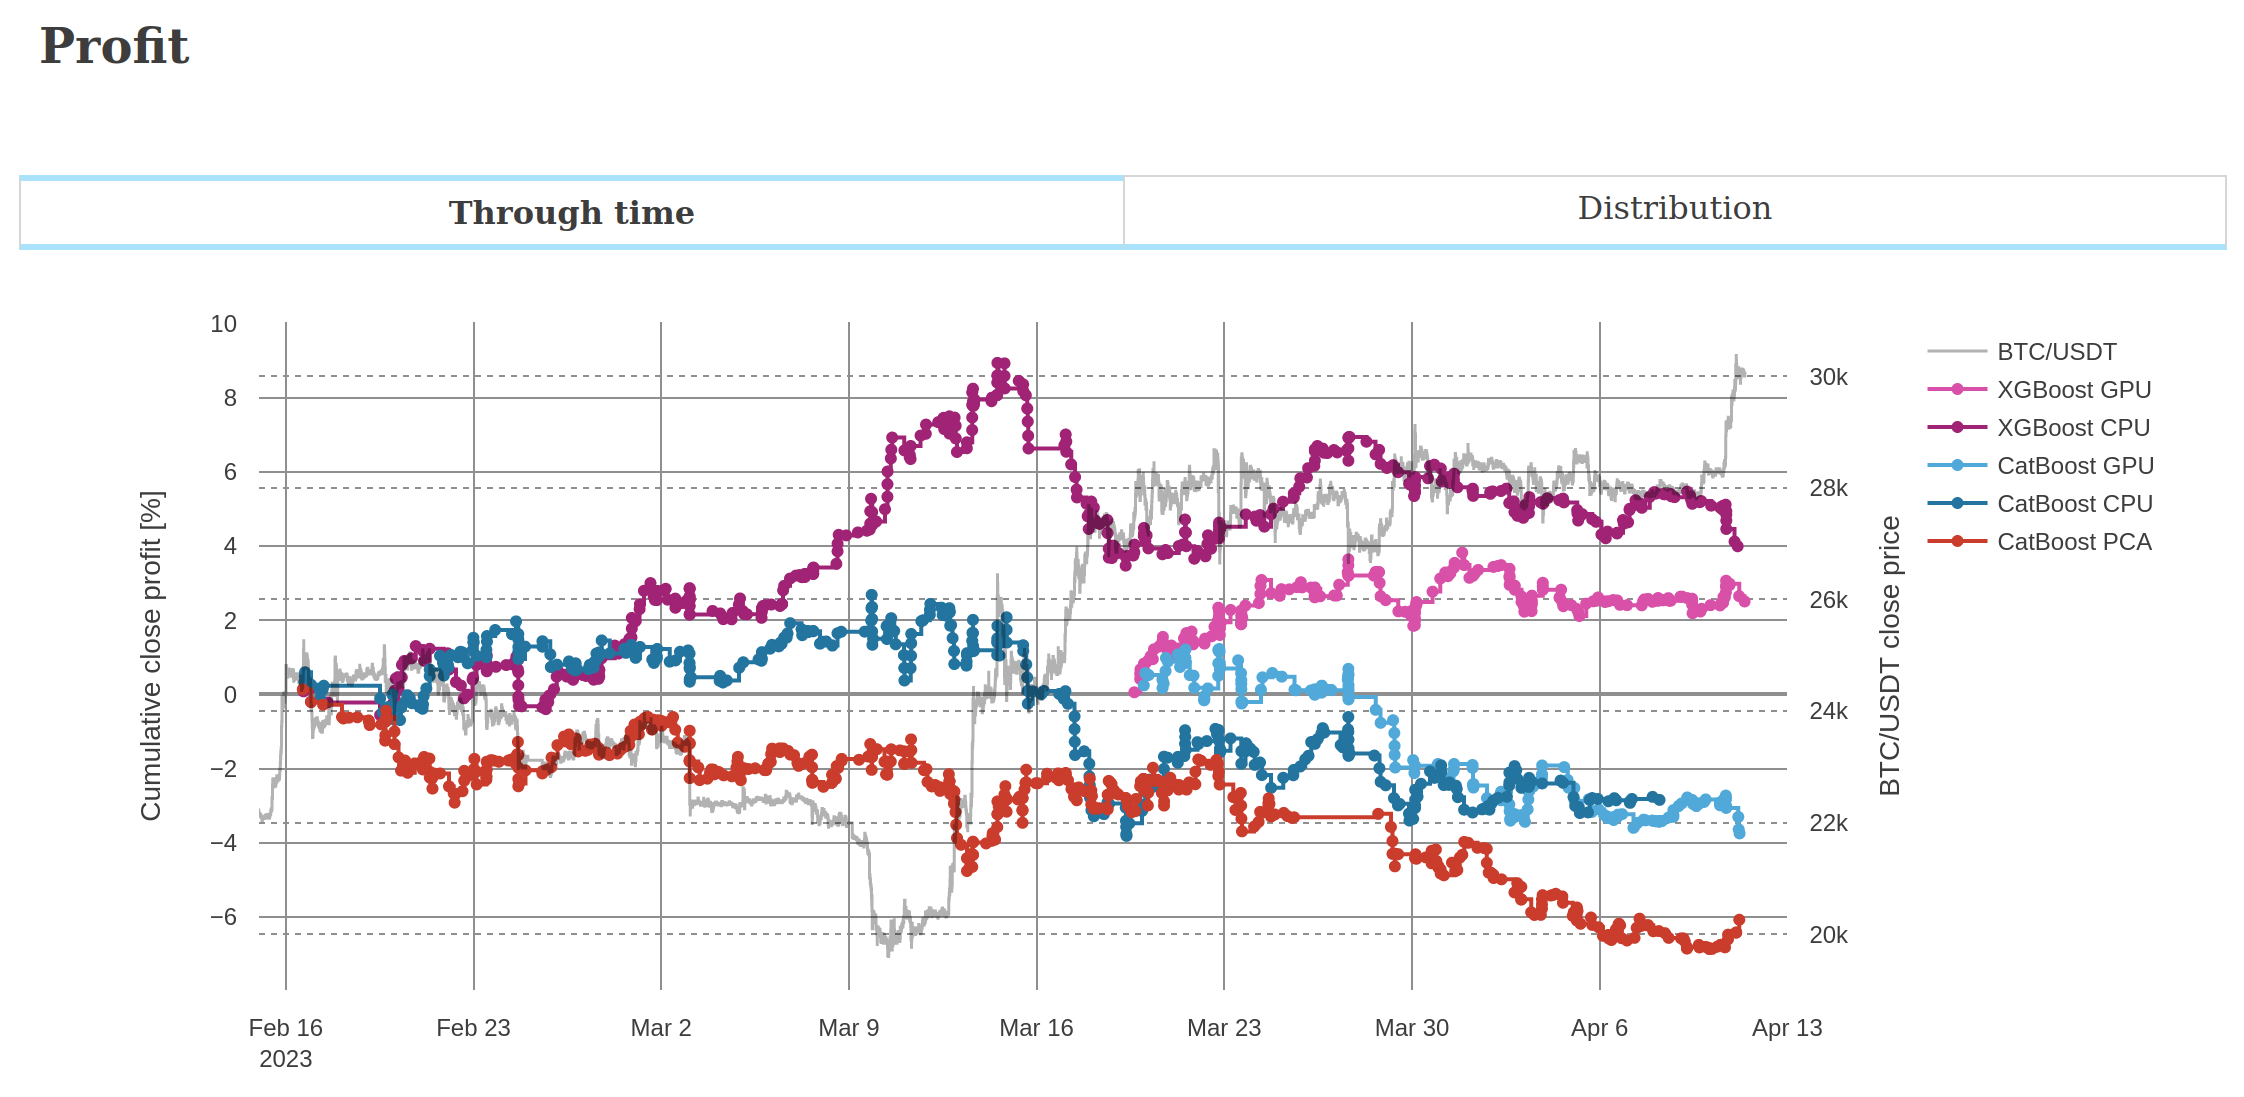
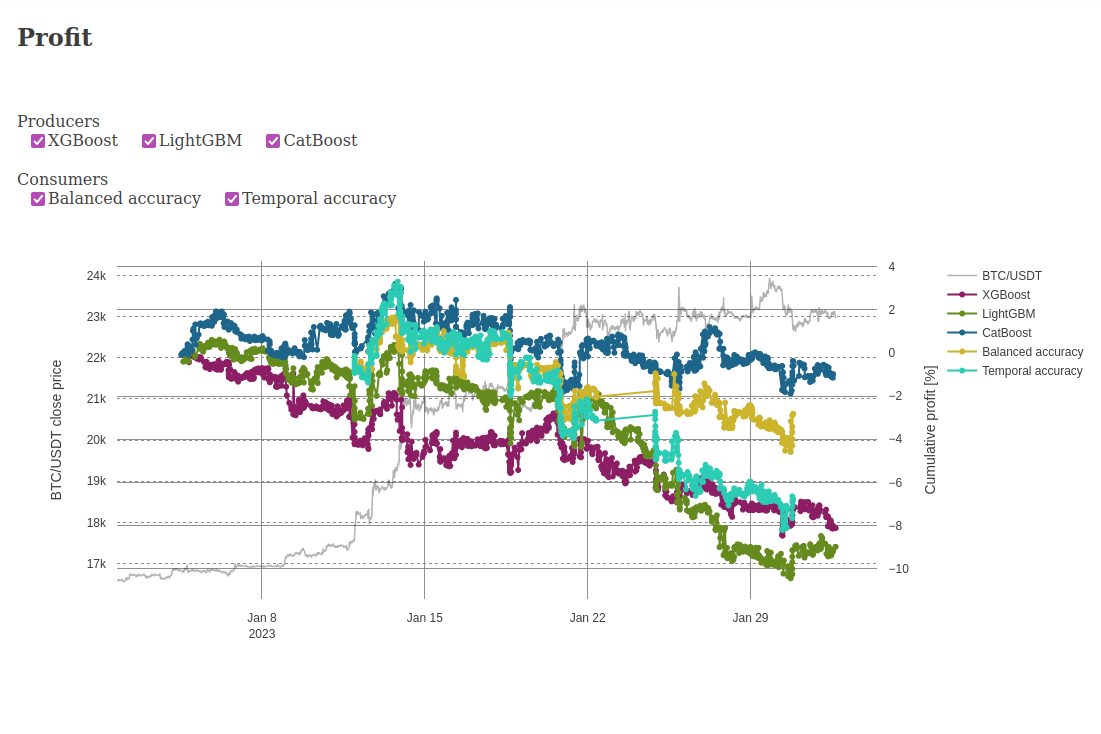
Below are screenshots from the dashboard reporting live results during the experiment.